How to Create a Social Media Report (with a Template)
A step-by-step process to create a social media performance report with a downloadable template.

Lucy K
Contributing Writer @ Quorage

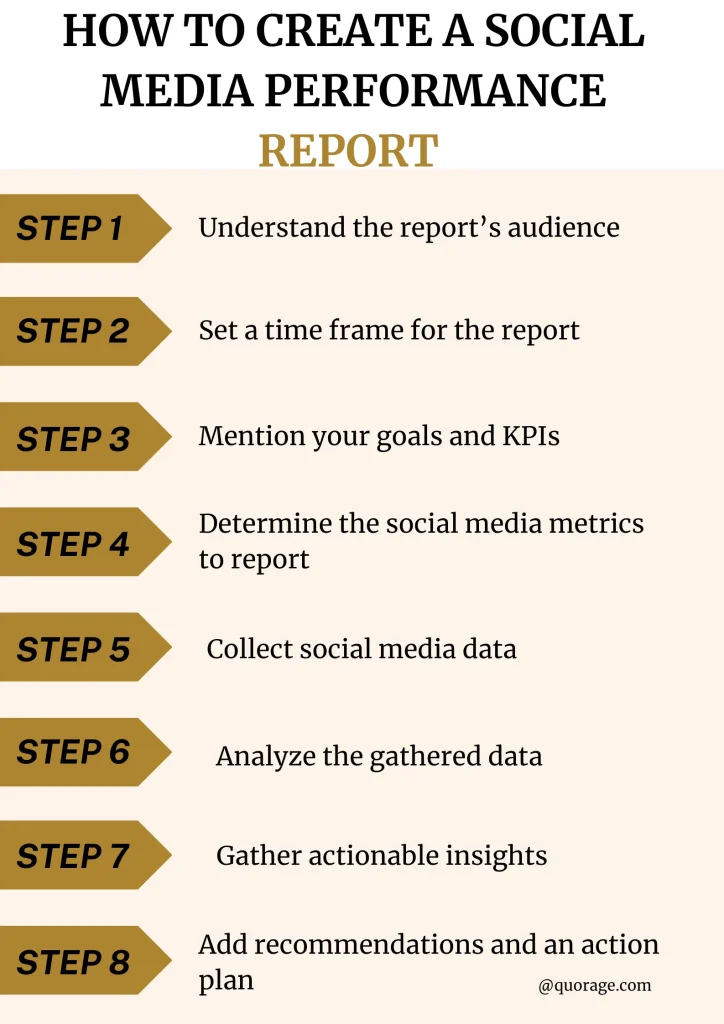
To create a social media report, first determine who will read it. Then, define your performance goals and KPIs, set a reporting timeframe, and choose the metrics to track. Once done, collect and analyze social media data. Finally, gather insights from the analysis, and give your recommendations and action plan as you share your findings.
What you include in your social media report will depend on your business goals and the kind of report you’re creating.
Most social reports will have an executive summary or introduction, social media goals, and the key metrics or KPIs. They’ll also include data analysis, insights, and recommendations (or conclusions).
A social media report helps you measure your social media performance and share it with decision-makers. Plus, you’ll gather helpful insights to help you make smart, data-driven decisions. For instance, you can adjust your content calendar to include content types that get the highest engagement.
This guide covers how to build a social media performance report to analyze and share your social media performance. We also provide a free, editable social media report template so you don’t have to start from scratch.
Let’s get started!
Free social media report template [editable]
Our free template guides you on how to write a social media report. It will help you organize the data to showcase your social media marketing performance.
It is downloadable, editable, and presentation-ready. So you don’t have to start from zero. You only have to fill it in as you follow the steps we’ve provided in the section below.
How to create a social media report step-by-step
To create a social media report, use a template (like the one we’ve provided above) and follow the steps below.
Step 1: Understand the report’s audience
Understand your target audience first to choose the type of social media report to create. The recipient determines what to include in a social media report. The target audience could be a marketing manager, high level executives or the business owner.
If you’re reporting the results of a social media campaign to the marketing manager, you’ll prepare a campaign report which includes metrics like click-through or conversion rates, ROI (return on investment), and ROAS (return on ads spend).
On the other hand, you’ll create a more comprehensive report when communicating the performance of a company’s social media platforms to high level executives. Here, you’ll include brand health analysis, competitive analysis, and sentiment analysis.
Mention who the report is intended for on the cover page.
To do: Go to the social media report template’s third slide and fill in the report’s target audience right next to “Presented to“. Then, fill in the “Executive Summary” slide to highlight what your report will cover.
Step 2: Set a time frame for the report
Set a time frame for your social media report. It could be a week, a month, a quarter (3 months), 6 months or 1 year, depending on the agreement you have with the recipient.
To do: Go to the social media report template’s third slide and add the report’s timeframe in the cover page. For example, “Social Media Performance Report Q1 2025”.
Additionally, mention the timeframe in the “Executive Summary” section. For example “This report highlights the performance of [Brand’s] Facebook, Instagram and TikTok pages from January 01 to March 31, 2025.”
Step 3: Mention your goals and KPIs
Before sharing success, mention the goals determined before the campaign began and the KPIs (Key Performance Indicators) to measure them. The goals provide a benchmark to judge the success or failures of your campaign.
For example, to track brand awareness, you’ll want to know how many people you’ve reached on social media. But if you want to measure a campaign’s performance, you’ll focus on metrics like conversion rates and ROAS.
Key performance indicators (KPIs) help you measure your performance. For instance, if your goal is to increase engagement rate on Facebook posts, the relevant KPI to track here is the percentage of engagement rate.
It’s good practice to use the SMART framework when writing your goals. That means that they should be:
- Specific, e.g., to increase engagement rates on Facebook posts by 5%
- Measurable, e.g., to grow Instagram followers from 1000 to 2000 over the next 6 months by posting 4 times per week and including 5 targeted hashtags on every post
- Achievable, e.g., to reduce customer response time from 48 hours to 24 hours in the next 3 months by automating workflows.
- Relevant (realistic), e.g., to achieve a 5% conversion rate on a paid campaign promoting our software via Facebook ads within 30 days.
- Time-bound, e.g., to collect 100 email sign-ups on our LinkedIn newsletter in the next 3 months.
To do: Fill in the campaign’s predefined goals and their KPIs in the “Social Media Goals/Targets” section on your social media report template.
Step 4: Determine the social media metrics to report
The social media metrics to track will depend on the campaign’s goals. Focus only on the metrics that matter to keep your report concise.
For instance, if the goal was to get more conversions from ads, you’ll focus on metrics like click-through rates, sales, and ROAS.
But if you want to measure brand awareness, you’ll focus on mentions, impressions/reach, website clicks, and follower growth.
Other important social media metrics include:
- Sentiment analysis, e.g., positive or negative tone in posts or comments
- Audience growth, e.g.,. audience demographics and active times
- Competitor analysis, e.g,. share of voice and follower growth
For best results, track both quantitative and qualitative metrics. For instance, you’ll want to know the context behind a spike in mentions related to your brand.
To do: Collect performance data. More in step 5 below
Step 5: Collect social media data
Go to your social media platforms’ built-in analytics tools and gather data that reflects the chosen metrics. Record everything that illustrates success – from follower growth to best performing content formats. Take screenshots and notes.
For example, Facebook’s Meta Business Suite gives comprehensive insights into your performance. You’ll know how many people you’ve reached, who interacts with your content, and how your content performs. Take screenshots of various reports.
You can also use third-party social media monitoring, listening, or analytics tools to collect data. Most of these tools will allow you to customize your metrics so you’ll only collect data that’s aligned with your social media goals. And you can quickly export or screenshot various reports.
A few examples of social media analytics tools include:
- Hootsuite
- Brand24
- Brandwatch
- Sprinklr
- SproutSocial
- Talkwalker
To do: Gather data insights from your preferred tool. Then, copy-paste the screenshots into the appropriate sections of your social media report template. For example, mention the attained targets in a table or as notes in a bullet list in the “Success Overview/Achieved Goals” section. You can also create charts to visualize the information (instead of using notes).
For more platform-specific results, go to the appropriate slide. For example, put the Facebook performance data under “Facebook Performance” and “Facebook Performance Screenshots.” For these platform-specific sections, make before-and-after comparisons of performance between two periods (like between this quarter and the last quarter).
Step 6: Analyze the gathered data
Analyze social media data based on the predefined goals. The analysis will guide your recommendations for improving the social media marketing strategy. Meta Business Suite helps with various analyses. All you need is to screenshot various reports like “Audience Trends” and “Most Active Times.”

You can segment your social media data analytics into categories such as:
- Audience analysis
- Content performance analysis
- Sentiment analysis
- Competitor analysis
- Influencer analytics
- Diagnostic analytics
Most analytics tools automatically generate reports for various analyses. In most cases, you’ll only need to export data into your preferred format. For example, you can export follower growth as a line graph or your audience demographics into a pie chart.
As a best practice, analyze data regularly and in varying time periods to spot trends and patterns.
To do: Generate visuals from your social media built-in analytics tools and third-party tools. Then, copy-paste them into the “Data Analysis” section of your social media report.
Step 7: Gather actionable insights
Once you’ve analyzed data, put together some actionable insights to communicate to the stakeholders what the numbers mean and the context behind them.
For example, if you’ve gained 50 followers in a month, and that number has risen by 50% from the last reporting period, it’s good to answer these questions:
- What happened?
- When did it happen?
- How did it happen?
- Why did it happen?
- What are the key takeaways?
Some analytics tools will do this for you. For example, if there was a spike in your brand’s mentions after a product launch, it could mean that many people are aware of this product. Still, they could be expressing their satisfaction or dissatisfaction with the product.
To do: Go to the “Key Takeaways” section on your social media report and list down all the actionable insights you’ve gathered from analyzing your data.
Step 8: Add recommendations and an action plan
After adding the lessons gathered, give actionable recommendations to the person (or people) reading your report. You can also give a conclusive action plan on how to improve your social media strategy.
For example, if your follower growth has significantly reduced, you could recommend deeper audience research to understand who to target.
Or, you can recommend consulting a specialist if you’re planning to run paid ads on a specific platform. That way, you’ll know the strategy to apply for the best results.
It’s a good practice to be clear and precise when giving recommendations or an action plan.
To do: Fill in your suggestions or action plan in the “Recommendations” section of your social media report template.
Step 9: Share and present your findings
Review your social media report to confirm that everything is in place. Once done, share the report with the intended audience.
Depending on the template used, you can either download the report as a pdf or share it as a link.
To do: Review your social media report and share it with your team or stakeholders.
Note: Here are some bonus tips on creating social media reports:
- Keep them brief and to the point – only focus on the metrics that align with your goals
- Customize your reports for different stakeholders (audiences).
- Create regular reports for easy follow-up.
- Be honest and transparent about what worked and what didn’t.
- Use screenshots or pictures to highlight your achievements or great engagement moments with your audience.
What are the best social media reporting tools?
Our best social media reporting tools are Hootsuite, Brandwatch and RivalIQ. More on these below.
1. Hootsuite
Hootsuite is the best social media reporting tool for medium-to-large businesses. Its Social Media Analytics feature lets you track, analyze, and report on data from all your social channels. Plus, you get a customized dashboard where you choose only the metrics that match your business goal.
I love that Hootsuite offers editable report templates to present your social media performance. You can customize your social media report depending on what you’re tracking, including content interactions, competitor activity, and audience growth.
2. Brandwatch
Brandwatch is the top social media reporting software for intelligence reporting. It uses Iris, a generative AI model, to track and generate insights from online data. It also lets you train machine learning classifiers on how to group and analyze data.
And that’s not all!
Brandwatch offers exportable and customizable report templates to help you prove your social media efforts. You can share live screens using the Vizia add-on. Alternatively, you can export your analyzed data into Excel, PDF, or PowerPoint reports.
3. RivalIQ
RivalIQ is your go-to social media reporting tool for competitive benchmarking. It gives in-depth insights into how your social media performance compares to your competitors. For example, you get customizable competitive landscapes and filters to see what’s working for other brands.
RivalIQ also offers free head-to-head report tools for every social media platform. For instance, you can create a report comparing your Instagram business profile against a competitor’s. Plus, RivalIQ lets you audit your social channels and create reports using custom social media audit templates.
Here’s something to note: The best social media reporting tool should match your goals, needs, and budget.
If you’re just starting out, consider using built-in analytics tools on your social media platforms. You’ll get free insights into your social media platforms. I especially love how Meta Business Suite offers comprehensive analytics for Facebook and IG accounts.
Further read: The best social media analytics software
Create your social media report with our free downloadable template
A comprehensive social media report helps you summarize what matters to your company’s stakeholders. Creating one from scratch can be a hassle. That’s why we’ve provided an easy-to-follow, editable social media report template. Use this downloadable template to build a social media report that presents the insights you’ve gathered in a clear and organized way.
Social Media Reporting FAQs
What is a social media report?
A social media report is a document that compiles data from your social accounts over a specific time. It highlights your goals, performance, and the insights you’ve generated from analyzing social media data.
With a social media report, you can communicate your social media efforts with your team and other stakeholders. Plus, it gives context for decision-making, especially on future social media strategies.
You can also use it as a negotiation tool when striking deals with brands, influencers, or potential clients.
Which social media reporting metrics should I consider
Consider social media reporting metrics that match your goals. You don’t want to get overwhelmed with social media data that makes no sense to your business. So, first, determine what you want to achieve and then choose metrics that align with these goals.
Here are some examples of social media metrics and their respective goals:
- Reach, impressions/views, and mentions – Brand awareness and visibility
- Comments, likes, and engagement rates – Content performance and engagement
- Share of voice, sentiments, and follower growth – Competitive
- Sales, conversions, and ROI
- Audience demographics and active times
What should I include in a social media report?
What to include in a social media report depends on the intended audience and social media goals. For instance, if you’re presenting your report to potential clients, you could include an overview of your platform’s performance.
Most social media reports have the following components:
- An introduction or executive summary on what the report covers.
- Social media goals and KPIs that guide what metrics the report measures.
- Social media metrics to track and measure social media performance.
- Tracked data from social media platforms.
- Data analysis using visuals like charts, graphs, and screenshots.
- Insights/ takeaways gathered from the analyzed data.
- Conclusion/recommendations on how to adjust or improve your social media strategy.
What are the different types of social media reports?
There are different social media report types depending on the timeframe, purpose, and platforms being tracked.
The table below shows different types of reports.
| Time-based Reports | Social Media Goals/Purpose Reports | Platform Reports |
| Daily reports | Campaign reports | Facebook reports |
| Weekly reports | Content performance reports | LinkedIn reports |
| Monthly reports | Brand health reports | Instagram reports |
| Quarterly reports | Competitive benchmarking reports | TikTok reports |
| Annual reports | Revenue/conversion reports | X (Twitter) reports |
You got more questions? Share them in the comment section below.
